Discover lead magnet ideas from Site Search Tracking in Google Analytics
A hidden but insightful tool within Google Analytics is Site Search Tracking. Sounds complicated but that’s just the search box or bar that you see on most websites to help you find content.
You can set up Google Analytics to track search usage on your website. More importantly, it provides the exact terms that users were searching for on your website. Wow, this is great insight into the mind of your readers or users.
For example, are users searching for a topic that you have not covered in your blog? Or is there a popular search team that could be become a great opt-in pop up box? Or is your site navigation a bit confusing that users have to search for content that you thought was obvious?
We recommend the free WordPress Plugin from Sumo.com to offer lead magnets and sign up boxes.
How to Set Up Site Search on your Website
FIRST
First, login to Google Analytics and navigate to the property that you’d like to set up. You’ll find this under View Settings in the View section of the Admin panel.
Navigate to Admin >> View >> View Settings
SECOND
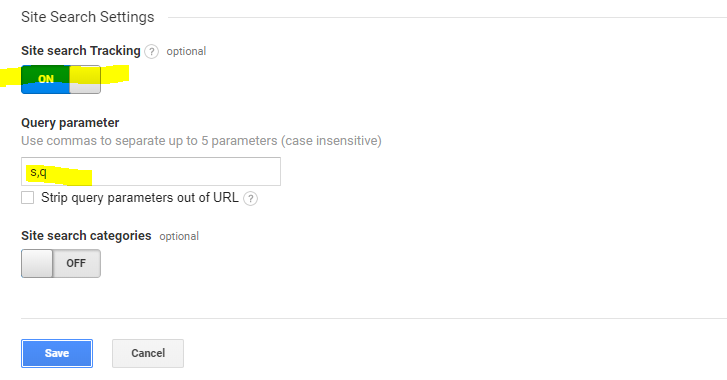
After you have clicked on View Settings, scroll down to the Site Search Settings area. Turn on Site Search
Tracking.
Then enter the query parameter or word that designates a search on your site. Mine is an “s” but I also entered “q” to be safe. It could also be search or query. To find your query parameter, do a search on your site and look in the URL.
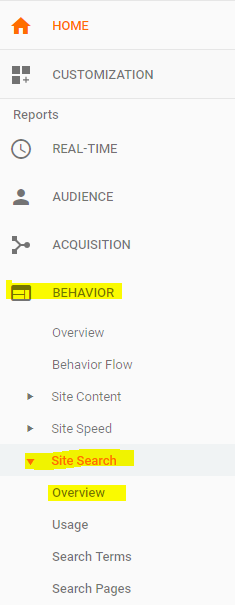
Now that Site Search is set up, it’ll take some to build up your site search history. Assuming you have some history, you can now view reports to see how many searches are being performed and for what words or terms. Great insight!
Navigate to Behavior >> Site Search >> Overview
FOURTH
You can check out the number of searches on your site, search terms, and what pages on your website that users are performing searches.
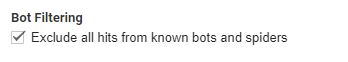
Oh, by the way, you might as well check “on” the box to exclude bots and spiders from your stats.
You’ve signed up and now you’re anxious to monitor and understand your website traffic. Follow the simple steps below to hookup your website. Remember, you can add as many sites as you wish!
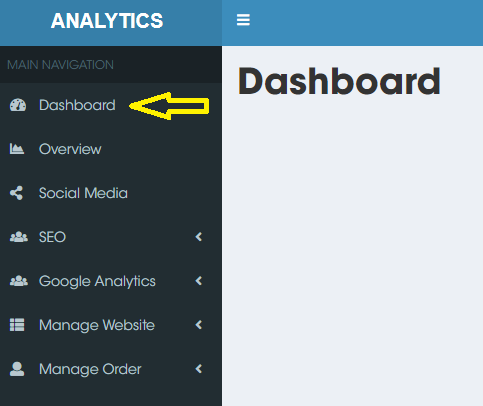
1) Log in to your SeoHighLighter.com account and navigate to the Dashboard page.
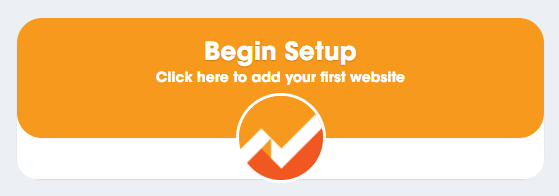
2) On the Dashboard page, you will see the “Begin Setup” button in the middle of the page. Click on that.
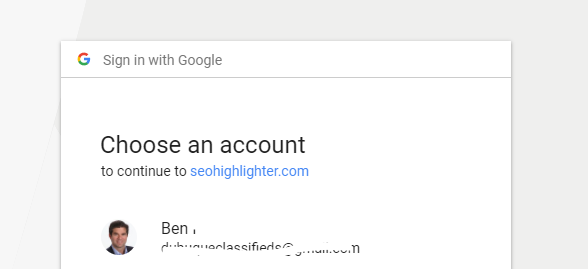
3) When you click on the “Begin Setup” button, you will be redirected to Google to authorize the connection between SeoHighLighter and Google Analytics. I find it easier if I am already logged in to the Google Analytics account that I would like to connect.
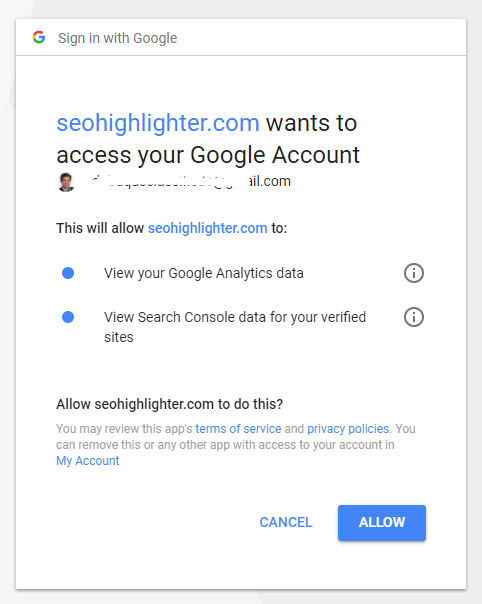
4) Once you have selected your Google account, we ask for your permission to connect SeoHighLighter to your Google Analytics and Google Search Console data.
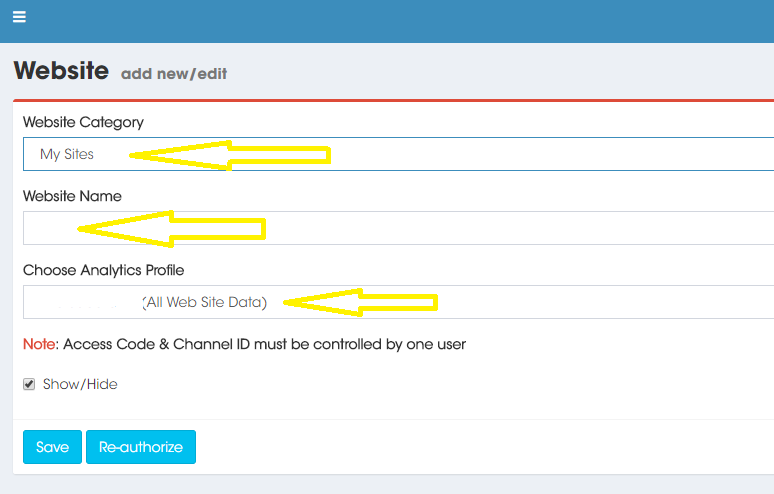
5) Click allow and you will be redirected back to Website set up page at SeoHighLighter. The default website category is “My Sites.” You can modify that later if you wish. Under “Website Name” type in a name that best describes your website. Under “Choose Analytics Profile,” there is a drop down menu where you can select the site that you’d like to connect. Click “Save” and you’re all set.
6) Repeat this process to add as many accounts as you’d like. If you have your Google Search Console account connected to your Analytics property, you’ll be able to use all features available in SeoHighLighter.com. Thank you for signing up!
Tracking email campaigns is an essential measure of business performance. Digital marketers rely on email campaigns to increase brand recognition, generate new leads, and bring targeted traffic to a landing page of choice. This short guide shows you how to track email campaigns with Google Analytics and is a must to determine the ROI of your campaigns.
Email is also an excellent communication channel to stay in touch with existing customers. People check their email more than their social media accounts – so if you are looking to strengthen customer relationships, there is no better outlet.
Of course, to achieve optimal results, you need to monitor what resonates with your audience by tracking email campaign performance metrics.
Why Should I Track Email Campaigns with Google Analytics?
Your email campaign is only as strong as the performance data it brings in. The goal is to have as many people as possible read the content of your email AND take the desired action.
An effective email should always have an actionable offering (an update from the business) or an incentive to keep reading (a discount on a product or free trial). Crafting the email is up to you – but when it comes to tracking, you need to ask yourself:
What is my email open rate? How many people are opening the emails?
Are new leads being generated?
Are new leads taken the desired action in the email (are they converting?) Did they sign up for my newsletter or make a purchase?
Having data-driven answers to these questions will help your marketing efforts thrive. To start tracking your emails, the first thing you need to do is install Google Analytics. Analytics is a free tracking software with tons of metrics and segmentation tools – just perfect for helping you increase click-through rates.
Using Google Analytics to Track Email Campaigns: The Basics
Once Google Analytics is installed, you can begin optimizing the software to suit your needs. Without any modification, Analytics will log the source of all traffic to your website pages. But after setting up an email tracking campaign, you will be able to see a new dimension in your traffic reports and discover a whole new world of traffic insight.
Step #1: Tracking URLs
Setting up URL tracking is a good idea whenever you are directing traffic from a source other than your homepage. It helps you know how effective your email campaign is in generating conversions (i.e., clicking on a link and landing on your website, for example).
Also, looked at over the long-term, URL tracking will show which emails brought higher than average conversion rates when compared with each other.
Trackable URLs break down differently for each traffic source:
● Email Campaigns. Allows you to see which emails are bringing in the most traffic and conversions.
● Guest Blog Posts. Helps you track the amount of traffic generated from a guest post on a different site.
● Influencer Marketer. If you are working with an influencer to promote a product, you should give them a trackable ID, so you know how much traffic is coming from their work compared to your email campaign.
● Banner Ads. Without a trackable URL, it would be hard to know which ad has the highest conversion rate.
Once your pages are trackable, the next step is adding parameters to each URL. Working with UTM parameters does mean delving deeper into the technical aspects of the platform. But it also guarantees more thorough reporting.
What are UTM Parameters and Custom Campaigns?
UTM parameters are little tags added to the end of a URL. Every time someone clicks on a link with UTM tagging; the information is sent back to Google Analytics. In short, UTM tags make it possible to isolate and measure different sources from where a searcher reaches your site. They are the buildings blocks for designing a custom campaign to monitor the performance of each source.
Custom campaigns are needed for every email newsletter promotion you want to track. You can measure key metrics and compare the performance of one traffic source with another over time.
For instance, let’s say you are generating tons of new leads from a new product offer. You want to know if your influencer marketing campaign is responsible for the spike in newsletter subscriptions, or if it’s coming from your newsletter. To check that, you need to set up custom campaigns for both your newsletter and your influencers newsletter, each optimized with UTM parameters. That way you can find out how many new leads are coming from your influencer’s newsletter campaign.
In general, segmenting data into categories via custom campaigns makes it easier to monitor the performance of specific traffic sources.
Step #2: Setting up UTM Parameters
The most important UTM parameters for all email campaigns are:
● Campaign source (utm_source). Usually listing the source of email list or newsletter (‘Welcome Email’ for example) where the link will be placed. This is where you can specify if it’s coming from an influencers account or not. Or if you’re promoting a social media post, I’ll type in Twitter or Facebook.
● Campaign medium (utm_medium). If you are running numerous email newsletters, you would want to differentiate them by publishing timeline (daily, weekly, monthly, May 23 Newsletter, etc.).
● Campaign name (utm_campaign). The name of the specific campaign itself (November eNewsletter, for example).
Consider filling out a Campaign Content (utm_content) parameter if you plan on doing any A/B testing. It lets you sort through the different links (image or text) that point to the same landing page URL.
Step #3: Using the Campaign URL Builder
Now that you know all the essential features of a campaign, it’s time to go ahead and build one. The Campaign URL Builder (save this link, you’ll use it often) tool makes it easy to start tracking your emails. Enter the following information:
Website URL (the URL for the page or post that your promoting)
Campaign Source (for example, ‘March Newsletter’)
Campaign Medium (for example, ‘email’, if you are sending an email campaign)
Campaign Name (for example, ‘sale’, but not required)
Once these four steps are complete, you will notice a ‘generated campaign URL’ pops up below the Campaign Content. Simply click ‘Copy URL’ and post it in your emails and share it with influencers, marketing collaborators, and business partners.
What Are Best Practices for Building Trackable URLs?
As with any technical domain, you want to keep things as simple as possible. With that in mind, you should pick a naming convention and use it every time. If you go ahead and make ‘unique’ names for each campaign title, it will be harder to remember which name applies to which data set.
A second recommendation is to use appropriate language throughout. Although it can get tedious working on website development, you have to remember that your audience will see the tags you write – who knew that branding gets so technical!
Step #4: Viewing the Results
Once you have let your campaign run for 24, you will start to see data coming in. To check the status of your email campaigns from the Google Analytics Dashboard, follow these steps:
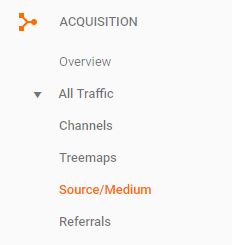
Sign in to Google Analytics
Select Acquisition from the topics on the left navigation side-bar.
Scroll down and select Source/Medium.
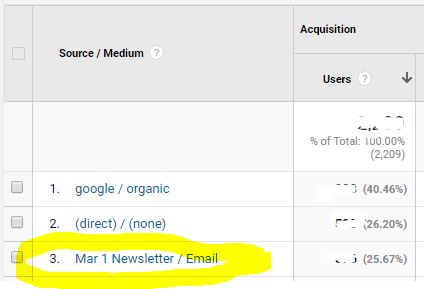
Tracking example of a March newsletter.
In the Source/Medium window, you will be able to see all of the different metrics for each newsletter that you send out. I like to review bounce rate, session, session duration, and goal conversions.
Conclusion
If you are not tracking email campaign performance, you should begin to track email campaigns with Google Analytics today! The more you know about the performance of your email campaigns, the easier it is to optimize them and make proactive changes for future email campaigns.
The only way to fully understand your site’s performance is with Google Analytics. To install Google Analytics tracking code, read this short guide to get started.
For beginners to Google Analytics, it might seem like a daunting challenge to get the infrastructure set-up. But with a little direction, it can be done. And before too long you will be receiving valuable traffic and performance reports for all the pages on your site.
What is the Google Analytics ID Tracking Code?
Google Analytics does offer some information about the ID Tracking Code. However, the instructions are quite technical and hard to interpret for a new user. But don’t sweat it – we have you covered!
1. Setting Up a User-ID
Setting up your tracking code is the first thing to do after signing up. In the Admin section of your Analytics homepage, you should see your account name linked to a site property.
Below the site property, notice the ‘Tracking Info’ headline. Click on it and select the ‘Tracking Code’ topic below the Tracking Info header. This is where your Tracking ID will be posted, in both an ID and HTML code form.
2. Paste Tracking Code to All Pages
Simply copy and paste this code onto the various pages of your site. In most cases it is placed above all the text in the <head> section of the site. If you are operating an e-commerce site via Shopify, they will provide clear instructions for where to apply a tracking code for the whole site.
If you are using WordPress, it is even easier! I recommend installing the Sumo or Google Analytics Dashboard for WP plugins. With these plugins, you simply copy and paste your tracking ID to the settings section of the plugin or authorize the plugin to use data from your Google Analytics account. No coding required.
3. Session Unification Is Helpful
Session unification is important because it ensures that when the same person searches for your site from two different platforms, Your Google Analytics software is able to associate them as coming from the same person, rather than two different people.
It is part of a larger User ID tracking system designed to streamline your customer insights, and as such makes for an important addition. To set it up, simply go to the Admin section of your Analytics account, click on User ID, and then select ‘Step 2’. You will see a toggle switch currently in the OFF position. Switch it to ON, and congratulations, you have just initiated session unification.
4. Verify that the Google Analytics Tracking Works
Once you have set everything up on the back end of your site, it’s time to verify that data is actually coming in! It takes approximately 24 hours for the first session views to be reported, and there are a couple of ways to ensure it’s all working for you.
Check the “Status” message on the page you applied the ID code to. If it states “Receiving traffic” then everything is as it should be.
Observe the number of people using your site right now in the Real-Time data section. To see if tracking works, simply browse through some pages of your site and see if they appear in the Real-Time data section.
Start Slow and Build Up a Solid Base
I hope this guide is useful to you when you install Google Analytics tracking code for your website. While it might take a few months to gather solid data on your site, by installing Google Analytics tracking, you are making it possible to optimize areas of your site you never thought possible.
New Feature: Google Analytics Weekly Email Summary
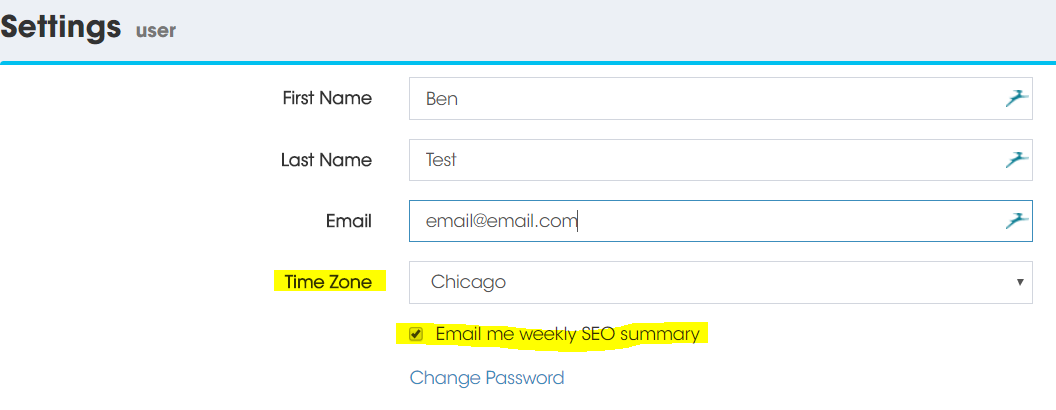
We just a released a new feature that will make it easier than ever to monitor your website traffic -> a Google Analytics Weekly Email Summary. Whether you are in our free or paid plan, you will receive a weekly email summary of your Google Analytics traffic.
You can expect email like the sample email below. Of course Site 1, Site 2 and so on will be replaced by the name of your website. Make sure you select your timezone in your settings page so that we can deliver your email at the correct time.
Every Monday morning, you can expect an email delivered to your inbox with important website traffic data. The weekly email summary covers the time period from Monday to Sunday of the prior week.
Of course, you can unsubscribe at any time in your settings page, but we know that you’ll find these Google Analytics summaries very valuable. In a future release, we plan to show the percentage changes over the previous week.
Sample Email
Hello Ben,
Here’s your summary of activity from last week.
* Site 1 had 1,378 sessions, 2,202 page views, 1,125 users, 1.6 pages/session, 90.09 seconds average session duration and 77.21% bounce rate.
* Site 2 had 1 sessions, 2 page views, 1 users, 2 pages/session, 1 seconds average session duration and 0% bounce rate.
* Site 3 had 27 sessions, 105 page views, 18 users, 3.89 pages/session, 371.41 seconds average session duration and 55.56% bounce rate.
* Site 4 had 16 sessions, 20 page views, 16 users, 1.25 pages/session, 10.31 seconds average session duration and 87.5% bounce rate.
For more analytic details, please visit: https://www.seohighlighter.com/customer
Have a great week!
SeoHighLighter.com Team
To unsubscribe from these emails please follow this link https://www.seohighlighter.com/customer/user/settings.
Th average session duration in Google Analytics is an often used metric to understand the engagement of your website audience. Per Google Analytics, it is calculated as:
Average Session Duration = total duration of all sessions (in seconds) / number of sessions
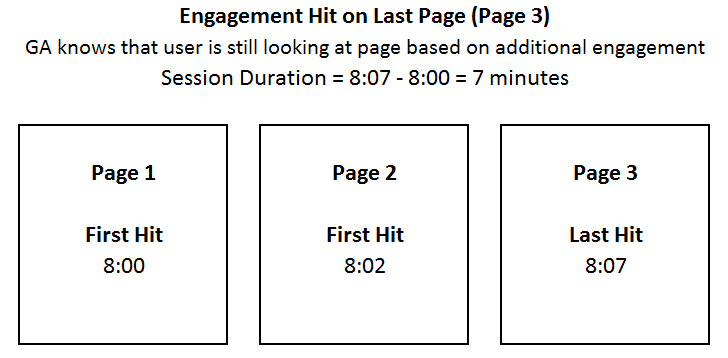
Engagement Hits on Last Page
As you enter the landing page of SeoHighLighter, for example, Google Analytics tracks the time from the first hit on the landing page to the last hit on the last page you visit. For example, you start on the landing page, check out the FAQ section, and then find yourself on this blog post. You read it and navigate back to Google.com. Because you left SeoHighLighter, Google Analytics can track the time at which you left this site.
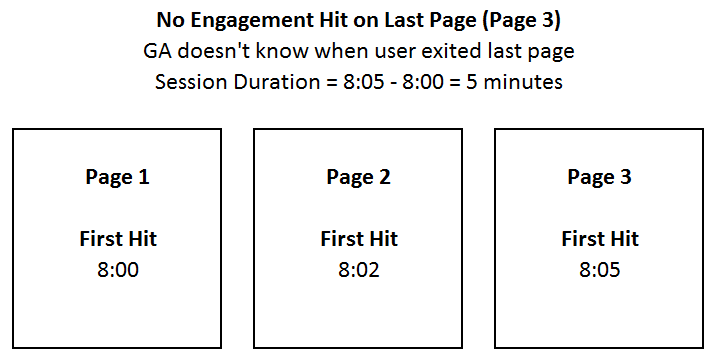
You’re Browsing and Leave for Lunch
However, what if you are browsing SeoHighLighter.com, for example, landed on the home page and are now reading this post and then leave for lunch. Google analytics has no clue how long you have spent reading this blog post.
Basically, when you don’t click anything else on my site or navigate away from my site, it stops the session duration at the time you first entered this blog post (assuming it was the last page your are reading on my site and then left for lunch).
Also, if you have high bounce rates, your session duration will drop because, again, GA doesn’t know how long spent reading this post if there is no last engagement to record another point in time.
Find your top pages in Google Analytics easily with this quick guide.
Google Analytics provides tremendous insight about your website visitors and content. One area of Google Analytics that I check constantly is my most popular content and pages. And, of course, you can also review your least popular content.
Understanding your most popular content can help you with your SEO strategy, content refreshes, calls to action, and much more. For your least popular content, it might also be an indication that you need to delete that content altogether, revise your page SEO, or revise the page or post to increase traffic or improve the specific goal for that content.
I’ll walk you through how to find your most popular content with SeoHighLighter and then with Google Analytics.
Finding your Top Pages in Google Analytics with SeoHighLighter
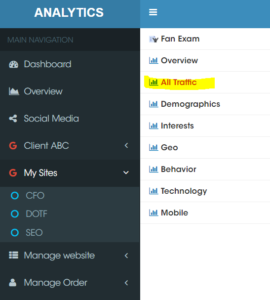
1)Login to SeoHighLighter at https://www.seohighlighter.com/customer/login.
2)Find the site that you would like to check in the navigation pane on the left and click on that site, and then click on “All Traffic.”
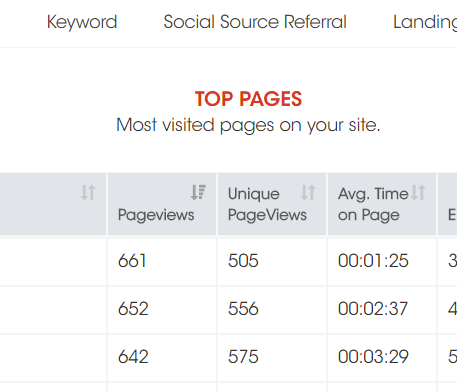
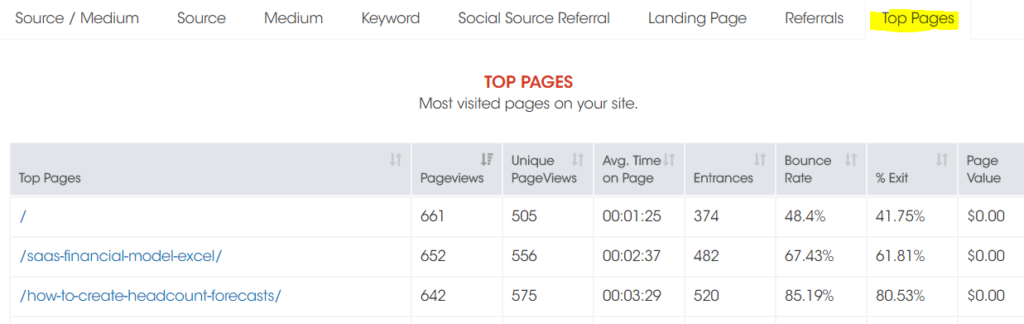
3)Scroll down slightly until you see the Traffic tabs and then click on Top Pages.
4)You will see a list of your top pages that you can sort by key metrics.
The data you can view on this page is below along with their definitions.
Pageviews – defined as a view of a page on your site that is being tracked by the Analytics tracking code. If a user clicks reload after reaching the page, this is counted as an additional pageview. If a user navigates to a different page and then returns to the original page, a second pageview is recorded as well.
Unique Pageviews – aggregates pageviews that are generated by the same user during the same session. A unique pageview represents the number of sessions during which that page was viewed one or more times.
Average Time on Page – the average amount of time users spent on a specified page or screen, or a set of pages or screens.
Entrances – is incremented on the first pageview or screen view hit of a session. In contrast, Sessions is incremented on the first hit of a session, regardless of hit type. Thus, there may be a discrepancy between Entrances and Pageviews or Screen views for properties where the first hit of a session can be an event hit.
Bounce Rate – is a single-page session on your site.
% Exit – For all pageviews to the page, Exit Rate is the percentage that were the last in the session
Page Value – is the average value for a page that a user visited before landing on the goal page or completing an Ecommerce transaction (or both). This value is intended to give you an idea of which page in your site contributed more to your site’s revenue
Finding your Most Popular Content with Google Analytics
1) Login to your Google Analytics account.
2) On the left navigation pane, click on Behavior -> Site Content -> All Pages
3) This will serve a page with a chart and table showing your most popular content.
In this short video tutorial, we demonstrate how easy it is to connect your Google Analytics data to SeoHighLigter. Once connected, just login to SeoHighLighter to view your GA data for one site or many websites.
Just Released: Google Analytics Social Media Dashboard
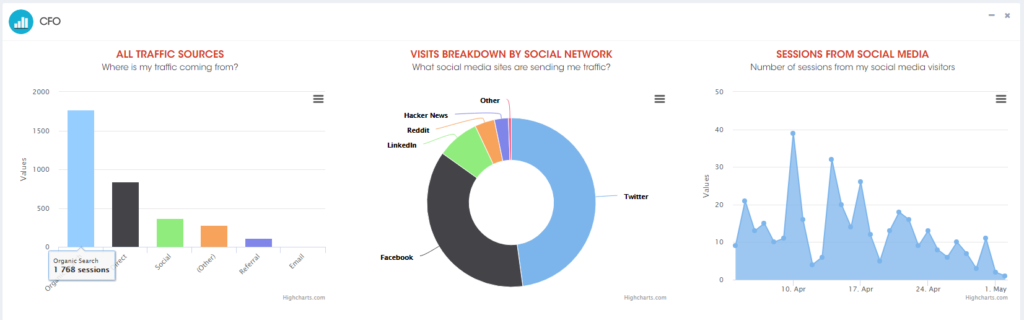
We are excited to announce our latest dashboard that will help social media managers, marketers, and more understand their traffic from social media networks. Our Google Analytics social media dashboard will quickly get you up to speed on how well your social media efforts are translating into website traffic and which networks perform the best.
Our site is mobile responsive so you can check your dashboards at anytime and from any device. In real time.
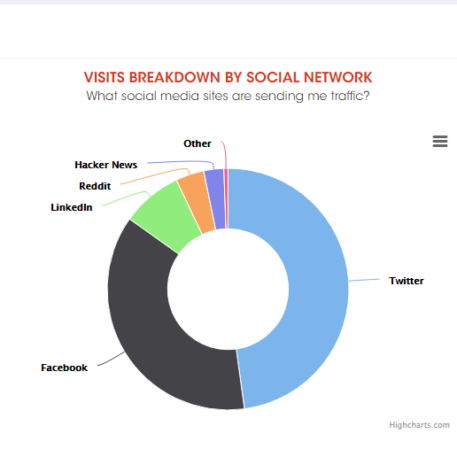
Check out select samples of the social media dashboards below. We’ll help you answer the following questions and more.
Where is my traffic coming from?
What social media sites are sending me traffic?
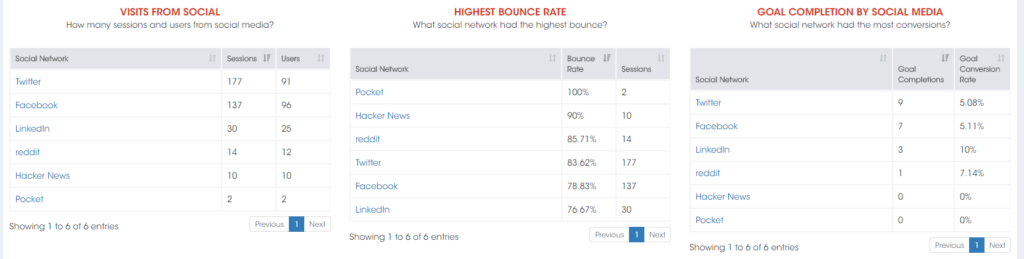
How many sessions and users were driven by social media?
Social Media Dashboard: Traffic sources, which social networks, and sessions
Quickly understand the traffic sources from your website and then which social media networks are sending you traffic. Then check out session activity based on the date range of your choice.
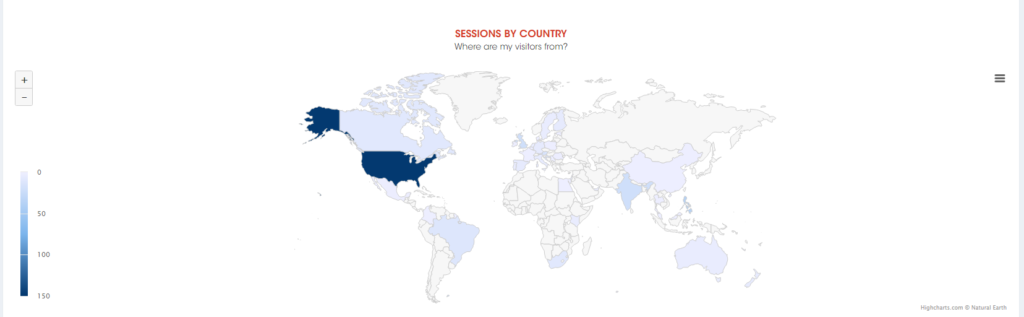
Social Media Dashboard: Sessions by country (interactive)
Use your mouse to zoom in and out of regions to understand what countries are sending you traffic. Use this to fine tune your ad campaigns.
Social Media Dashboard: Visits by network, bounce rates, goal completions
Now you can rank your best performing social media networks by sessions and goal completions and also see which network bounces the most.
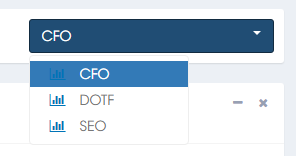
Check all of your domains with an easy drop down menu
Our Google Analytics social media dashboards will help you save time finding the most important data and save you from logging into Google Analytics and searching for the correct information.
Future releases will include dashboards by social media network (i.e Facebook, Twitter, etc.) for a more detailed understanding of your audience.
Creating goals in Google Analytics is a great way to understand user actions on your website or app. Do you want to know something specific about your visitors? How long are they visiting? Did they take a specific action on your website?
A great and easy way to get started quickly is to track the number of email sign ups on your website. Email is still a great marketing tool, so if you have a newsletter sign up, this guide is for you.
Defining an email conversion goal is a basic component of understanding your marketing effectiveness. Google Analytics provides great insight into what traffic provides the most email sign ups, for example. You can answer questions such as, “what social media channel is the most effective to attract email sign ups.”
It takes only a few minutes to create a goal, so let’s get started with the step-by-step guide below.
How to Create Goals in Google Analytics
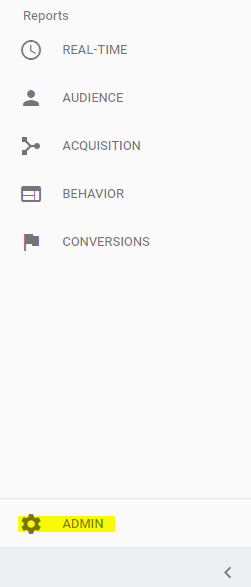
Sign in to Google Analytics.
Click Admin in the navigation pane on the left.
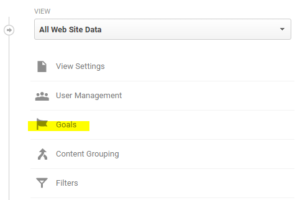
In the View column on the right side, click on Goals.
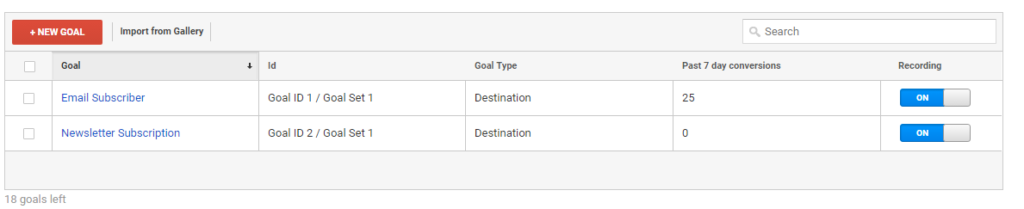
Click on the New Goal.
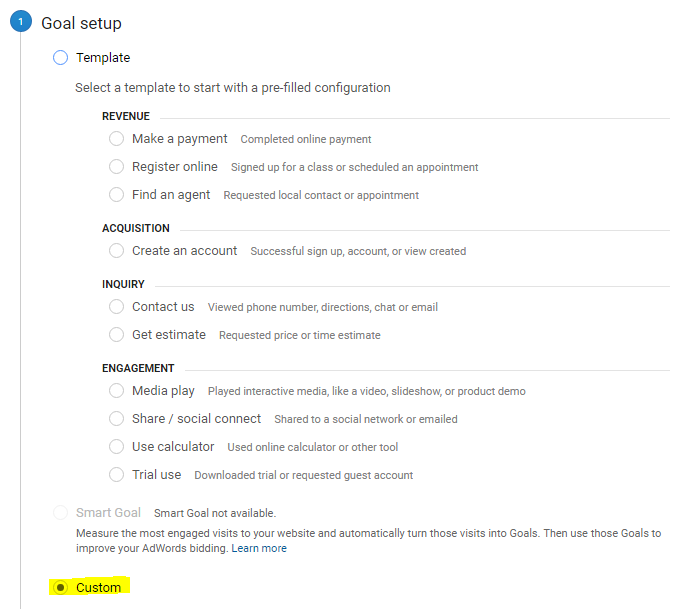
In the Goal Setup, select the custom button at the bottom.
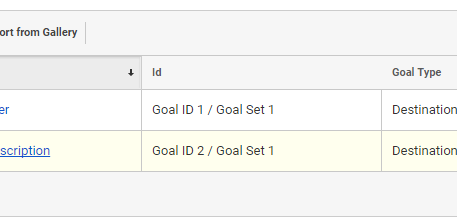
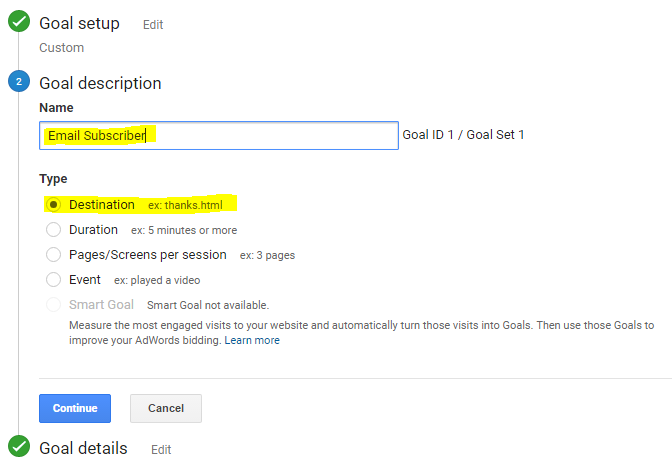
In the Goal Description, enter a name for your goal. In my case, I labeled it as Email Subscriber. I also click on Destination as Type.
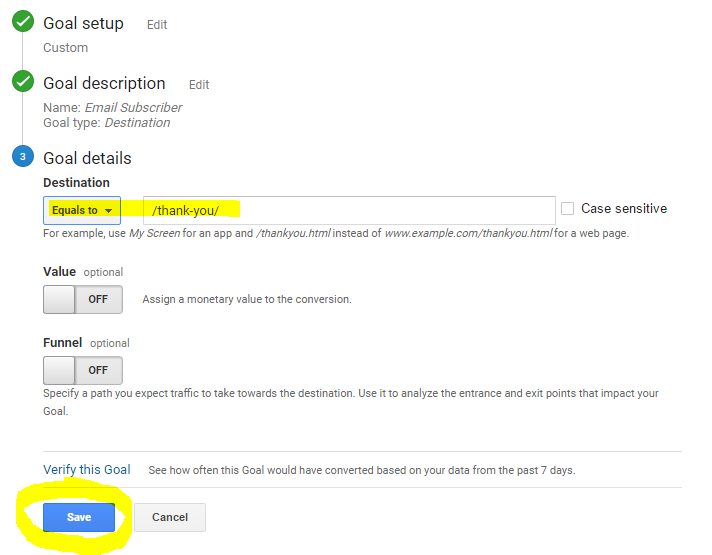
In Goal Details, set Destination as Equal To and the name of the page that your visitor is redirected to after signing up for your newsletter. In my case, it is a thank you page. If you don’t have a success page after email sign, create a simple page labeled as “thank-you” and enter it in the Destination box below. Finally, click Save. You are all set. Google Analytics will start tracking your goal conversions.